
What the instrument rests on, what has been measured so far, and what is being measured next.
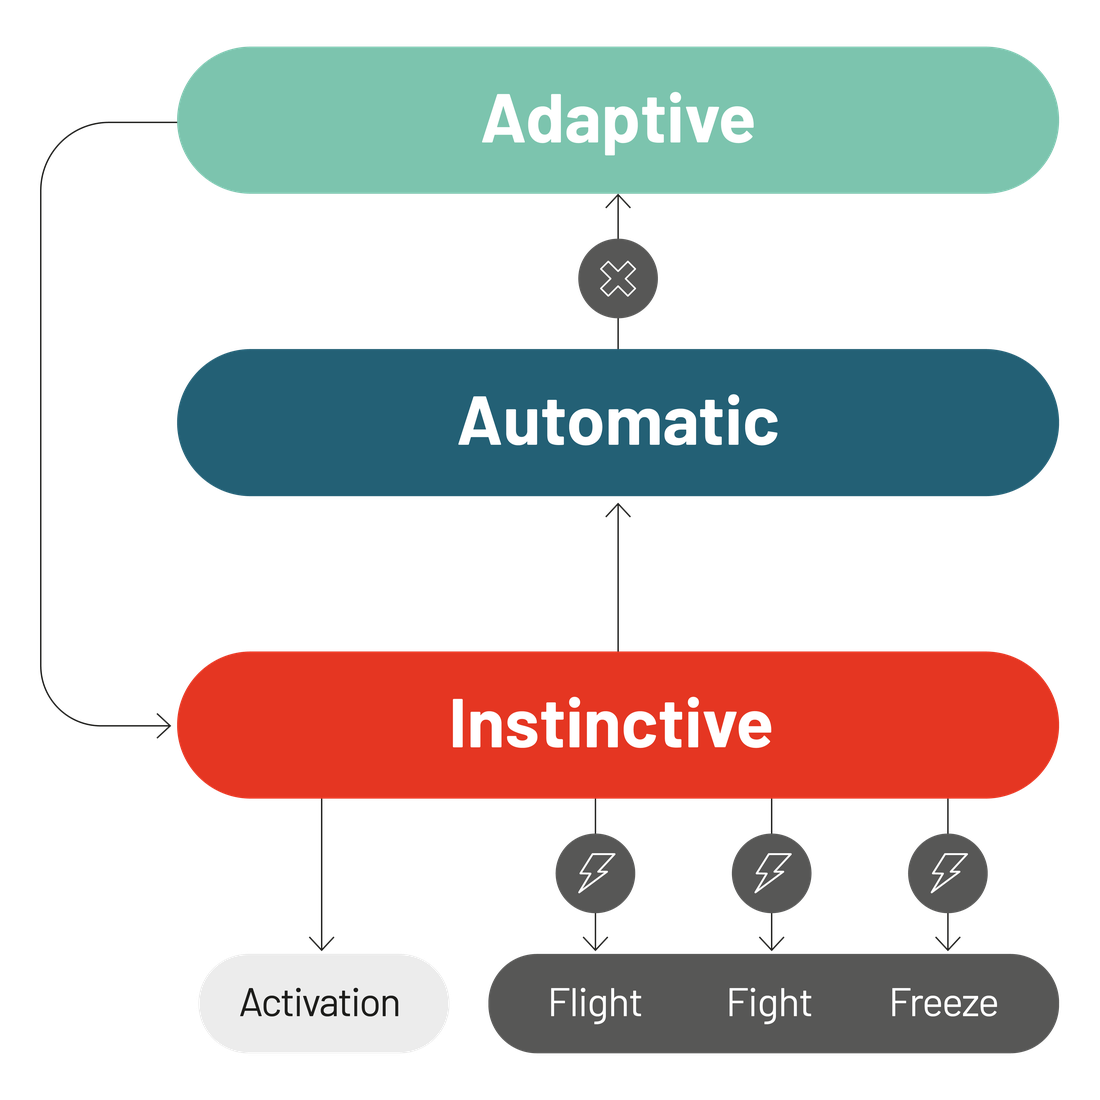
The REAL Profile is built on a dual-mode model of mental functioning: an automatic mode that handles the overwhelming majority of daily decisions, and an adaptive, prefrontal mode that can be recruited deliberately. The construct the instrument scores is adaptive response: how closely the response a person actually produces in a demanding situation matches the response that situation requires. The distance between the two is what we call the response gap. It is reported as the R.E.A.L. Adaptive Response Index™ — one score across the 24 competencies, with its two components: collect, the twelve competencies used to gather information without distorting it, and regulate, the twelve used to decide well and return to a settled state. These are two families of competencies rather than two moments in time, and together they cover the whole process. Read together, they describe a stance: where a person sits between reacting to a situation and authoring it. The Index is treated throughout as a trainable capability rather than a stable trait.
The framework draws on four contributing bodies of work: the neuroscience of stress response and prefrontal regulation; the four decision centres model; behavioural style models including DISC®; and systemic organisational theory (the Neurosystemic Approach). Items were developed to measure the behavioural expression of each of the 16 competencies rather than self-reported personality.
| Element | Status | Date |
|---|---|---|
| Preregistered analysis plan, filed publicly | Completed. The full protocol — hypotheses, thresholds, decision rules and exclusion criteria — was filed on the Open Science Framework on 31 August 2026, before data collection opened. DOI 10.17605/OSF.IO/CWD5Z — project files and materials: osf.io/xkyvf | August 2026 |
| Internal consistency (Cronbach's α), first analysis | Completed. Item-level revisions were designed and implemented as a direct result. | July 2023 |
| Internal consistency, second analysis on revised items | Preregistered and scheduled, n = 500 profiles. McDonald's ω at axis level; mean inter-item correlation at competency level. | October 2026 |
| Normative database | In construction — approximately 3,000 profiles completed to date | Ongoing |
| Technical manual | In preparation, following the October analysis | End of 2026 |
| Test–retest stability (four-week interval, no training between administrations) | Preregistered, n = 100. Yields the standard error of measurement and, from it, the smallest change that can be read as real rather than noise. | Winter 2026–27 |
| Responsiveness study (pre/post around training, with comparison group) | Planned — one documented case to date, see below | Q3 2027 |
| Construct validity study | Planned | Q3 2027 |
| Exploratory factor analysis | Preregistered, alongside the October analysis. It tests whether the 24 competencies load on a single dominant dimension — the stance the framework describes — or on several independent ones. We publish the result either way. | October 2026 |
| Public preprint with DOI | Planned, based on the technical manual | After the manual |
The sequence matters more than any single figure. The first analysis was not a certificate to frame — it was a diagnostic. It identified which items were carrying weak signal, those items were rewritten, and the revised instrument goes back under analysis in October 2026 on a dedicated sample of 500. This is the ordinary development cycle of a psychometric instrument, and we are open about being in the middle of it.
On 31 August 2026, before a single profile of the study sample existed, we filed the complete analysis plan publicly: the hypotheses, the numerical threshold each one must clear, the rule for what happens if a threshold is missed, and the criteria for excluding a response. It is timestamped and cannot be edited. Read the protocol. The underlying project — data-collection procedures and the definition of every index — is public at osf.io/xkyvf.
The point is simple. Anyone can run a series of analyses and publish the one that came out well. Fixing the criteria in advance, in public, removes that possibility — and it removes it for us specifically, since the instrument's author is also its commercial owner. That conflict of interest is declared in the filing, and is the reason for making it.
The filing also commits us to publishing the results either way. If the single headline score does not hold up as the measurement of one construct, the R.E.A.L. Adaptive Response Index will be restated as a descriptive composite, and this site, the report and the commercial materials will be amended within three months. That undertaking is in the protocol, not only on this page.
We publish validation status openly, including what has not yet been done. Distribution partners are welcome to review the underlying analysis under NDA.
Most assessments are validated on how little their scores move. This one has to be validated on the opposite property — and early evidence is encouraging.
Because REAL measures a changeable skill set rather than a stable trait, the psychometric question is not only "is the score stable?" but "does the score move when the underlying capability moves?" That property — responsiveness — is what an L&D buyer is actually paying for, because it is what allows a programme to demonstrate impact.
One certified practitioner completed the profile in December 2022, followed the REAL training programme, and completed it again in March 2023. The collect component of the Index rose from 63% to 83%, and the regulate component from 66% to 80%. Stage-level movement is shown below.
The three competencies that started lowest moved most: access your resources 11% → 83%, accept what is 38% → 96%, gain perspective 38% → 83% — precisely the areas the training targets.
And two scores went down. Act from the heart fell 8 points and commit fell 17. That matters: a respondent gaming a retest after reading their first report would push everything upward. Selective movement, including downward, is what genuine measurement looks like.
It is one person. It cannot separate the effect of the training from regression to the mean, from increased self-awareness changing how the person reads the questions, or from ordinary variation. We present it as an illustration and a hypothesis, not as evidence.
The proper study is a pre/post design across a cohort of programme participants, with a comparison group who complete the profile twice without training in between. That study is on the roadmap.
A naive test–retest study has a known weakness for a development instrument: a respondent who has read their report knows what the questions are looking for. We therefore intend to measure stability on a subsample who have not received their report between the two administrations, over a short interval and with no training in between — which isolates stability from both learning and impression management. Responsiveness is then measured separately, in the pre/post design described above. Conflating the two is the most common error in this category, and we would rather be explicit about avoiding it.
Case data published with the individual's consent and reported without identifying details.
9.3–10
Satisfaction range across programmes, 2025.
9.2 participants in 10 report that the skills acquired are directly applicable
in a professional and personal context.